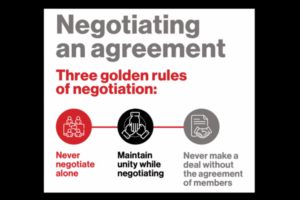

Bargaining Benchmarks is a resource for trade union negotiators. It provides negotiators with a series of benchmarks that will help them enter into bargaining processes as informed role players.
Price inflation – Cost of living
Inflation is the rate at which prices increase over time, resulting in a fall in the purchasing power of money. It is measured as an annual percentage increase (for example, June 2020 to June 2021). Inflation is almost always presented as an annualized number covering the previous 12 months.
The easiest way to understand inflation is to think of buying power. If a worker receives a 10% increase but the price of the goods that the worker buys also increase by 10%, then that worker will not be able to buy anything beyond what they bought previously, even though they appear to have more money. The worker, therefore, has the same buying power they had before, despite the 10% increase.
Consumer Price Index (CPI) measures changes in the price level of the market basket of consumer goods and services purchased by households. CPI represents the overall increase in the prices of all goods. The inflation rate as measured by the CPI was 4.9% in June 2021. This means that the price of goods and services generally increased by 4.9% from June 2020 to June 2021.
Figure 1: Consumer Price Index (CPI) and selected price categories | Q2 2021
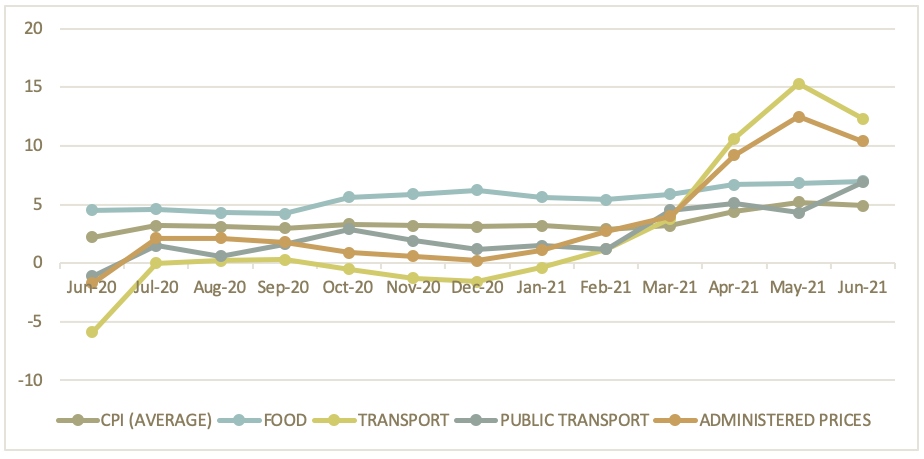
Source: Statistics South Africa (2020-2021)
While overall CPI increased to 4.9%, the price of transport-related items and public transport increased by 12.3% and 6.9%, respectively. Administrative prices (school fees, telephone, electricity, trains and petrol/paraffin) increased by 10.4% and the price of food increased by 7% in June 2021.
Table 1 shows the contribution of the main kinds of expenditure on the inflation rate for June 2021. Food and non-alcohol beverages and miscellaneous goods and services prices were the biggest contributors to the annualized inflation rate of 4.9% in June 2021.
Table 1: Contributions of the different groups to the annual percentage change in the CPI headline | June 2021
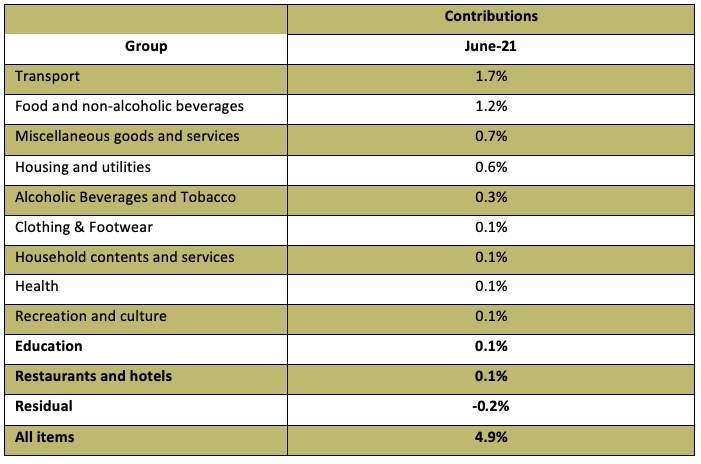
Source: Statistics South Africa (2021)
Remember that the inflation rate describes a rate of increase. So, if annualised inflation is lower this month than it was last month, it does not mean that things are cheaper. It just means that the prices increased more slowly than they did before. If we look even closer, we can see which sub-categories are currently driving inflation.
Although the CPI came at 4.9% in June 2021, other annualized items recorded increases above the consumer price index. For example, fuel (27.5%), private transport operation (22.4%), oil and fats (21.6%), meat (8.6%), vegetables (6.7%) and fish (7).
Inflation by expenditure group
There is more than one inflation number. The inflation rate that is reported in mainstream media is the average inflation rate. Different groups, from the very poor to the wealthy, can experience different rates of inflation because they buy different things.
The very low group (Decile 1) experienced an inflation rate of 5.2%, higher than the headline inflation rate of 4.9%, while the very high expenditure group (Decile 10) had an inflation rate of 5.1% in June 2021.
Table 2: Annualised inflation by expenditure group | June 2021
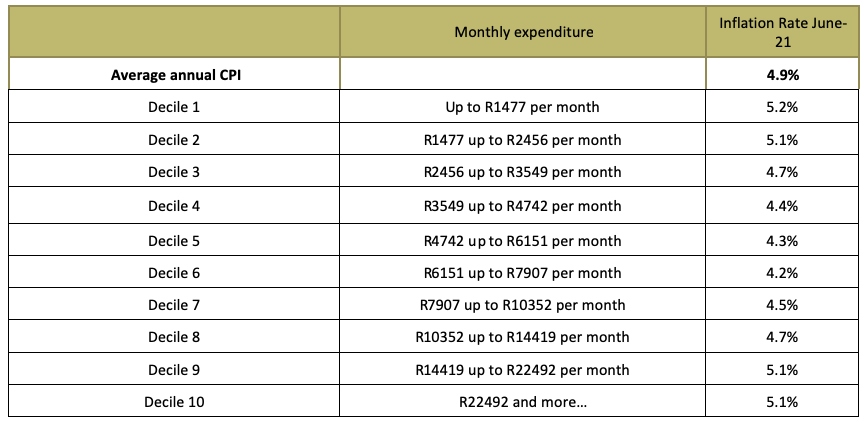
Source: Statistics South Africa (2021)
Inflation by province
The provinces with an annual inflation rate lower than or equal to headline inflation were Mpumalanga (4.6%), Gauteng (4.8%) and KwaZulu-Natal (4.9%). Free State (5%), Western Cape (5%), Northern Cape (5.2%), Eastern Cape (5.4%), Limpopo (5.6%) and North West (6.1%) recorded annual inflation rates higher than headline inflation.
Figure 2: Annualised inflation rate (%) by province | June 2021
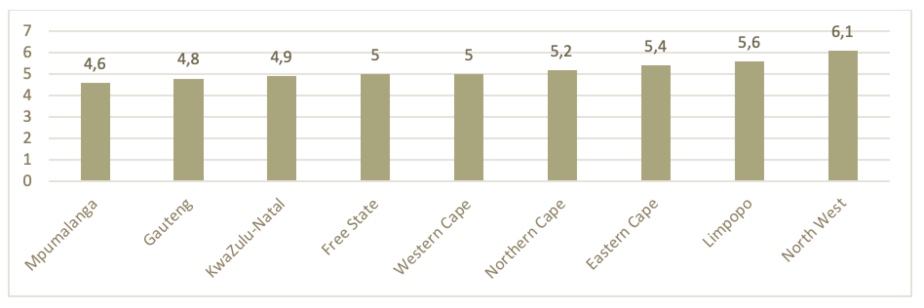
Source: Statistics South Africa 2021
Producer Price Index
The Producer Price Index (PPI) measures an average change in the price of a basket of representative goods and services sold by manufacturers and producers in the wholesale market, while CPI measures price changes in a basket of goods and services bought by the average household. The PPI can assist us in understanding what inflation might do in future. Many factors can influence the inflation rate, but the trend in PPI is one way of predicting what prices will do in the short term.
Figure 3 shows that the annualized PPI increased to 7.7% in June 2021 from 7.4% in May 2021. The CPI declined to 4.9% in June 2021 from 5.2% in May 2021.
Figure 3: Producer Price Index and Consumer Price Index | June 2021
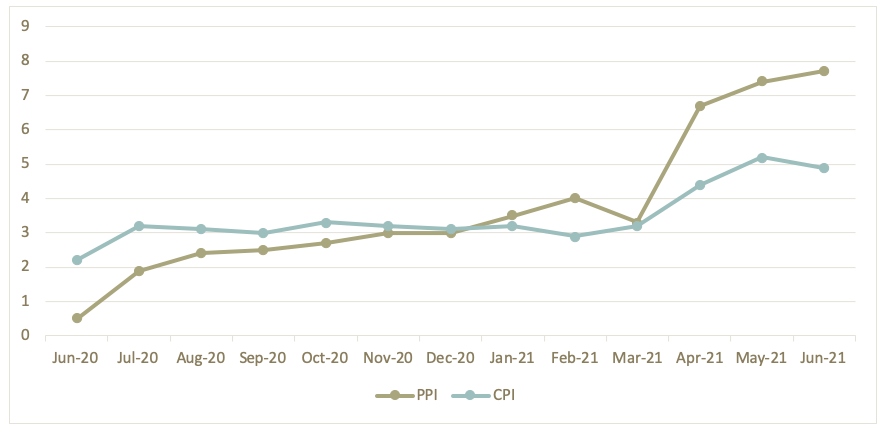
Source: Statistics South Africa (2020-2021)
Unemployment rate
The unemployment rate is the proportion of the labour force that is unemployed.
Figure 4 shows that the unemployment rate in South Africa increased to 34.4% in the second quarter of 2021, from 32.6% in the first quarter of 2021. This translated to a percentage change of 1.8% quarter-to-quarter.
Figure 4: Unemployment Rate (%) | Q2 2021
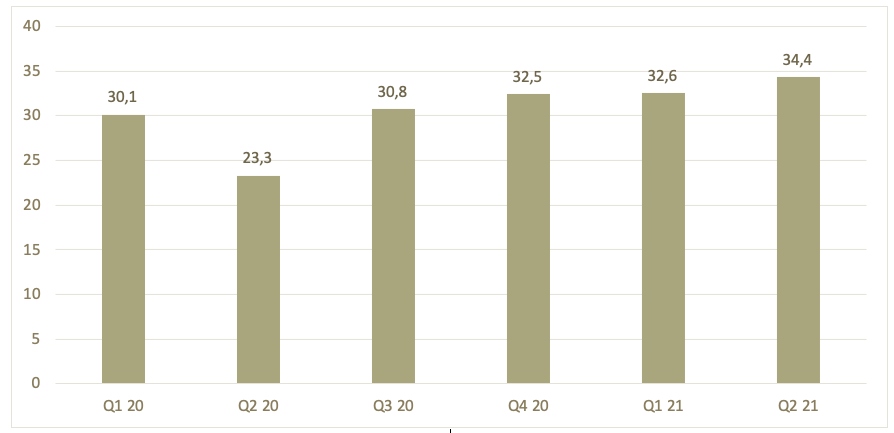
Statistics South Africa (2020-2021 Quarterly Labour Force Survey)
Economic Growth and GDP
The GDP represents the total market value, or prices, of all final goods and services produced in an economy during a period. GDP is expressed as a comparison to the previous year or quarter.
Figure 5: Growth in GDP % | Q2 2021
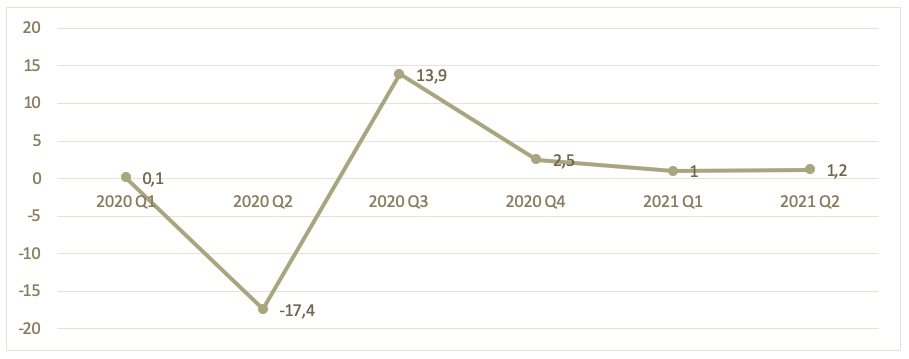
Source: Statistics South Africa 2021
The graph below shows that six industries recorded positive growth between the first quarter of 2021 and the second quarter of 2021.
The largest positive contributors to growth in GDP in the second quarter were transport (0.5%), personal (0.4%), trade (0.3%), agriculture (0.2%), mining and taxes/subsidies at (0.1%).
Negative contributors to growth in GDP in the second quarter were manufacturing (-0.1%), finance (-0.1%) and government (-0.1%).
Figure 6: Contributions to growth (%) in GDP by Industries | Q2 2021
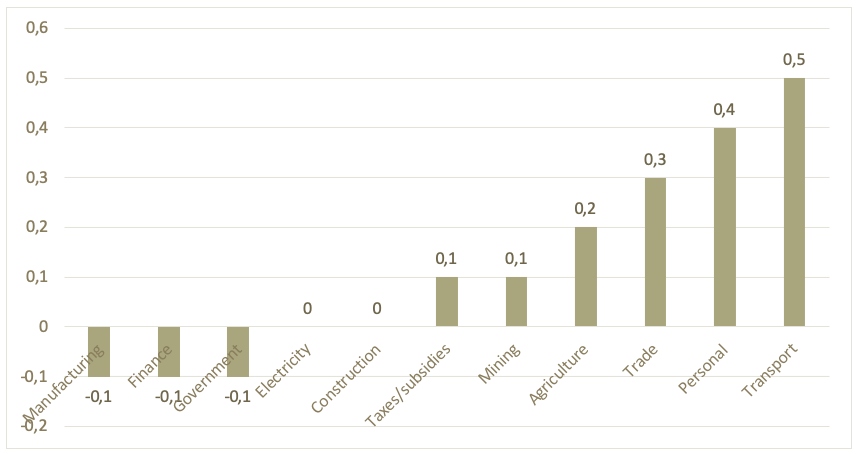
Source: Statistics South Africa 2021
Month-on-month household food basket index
The household food index is designed to measure food price inflation as experienced by households living on low incomes in Pietermaritzburg. It can be used to give insight on food price inflation as experienced by households living on low incomes in South Africa.
The graph below shows that the cost of the household food basket increased to R3 486 in the second quarter of 2021, from R4 128 in the second quarter of 2021. This translates to an increase of R642 or (18.4%) between quarter two of 2021 and 2020.
The cost of the household food basket | June 2020 to June 2021
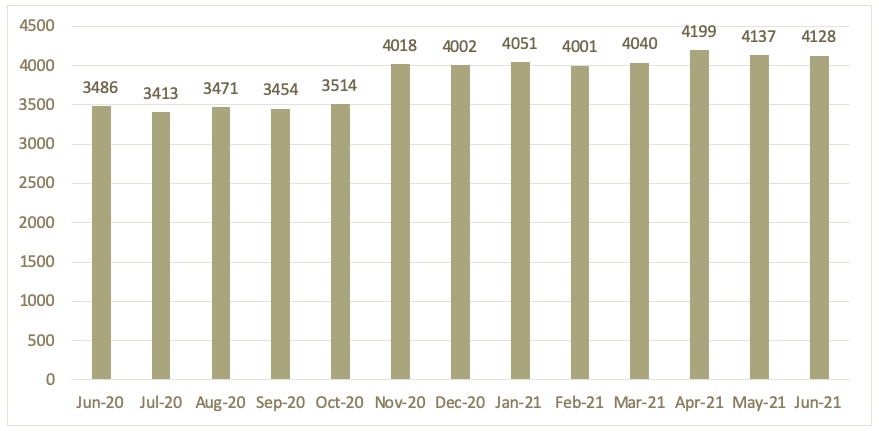
Pietermaritzburg Economic Justice and Dignity
Wage indicators
The Actual Wage Rates Database (AWARD) of the Labour Research Service samples agreements in any given year to determine the median wage increase across various industries. The information can be used to inform bargaining cases.
The table below provides wages, percentage wage increases and hours of work by various industries in the second quarter of 2021. It shows the minimum wages and percentages negotiated by unions in various industries in Q2 of 2021.
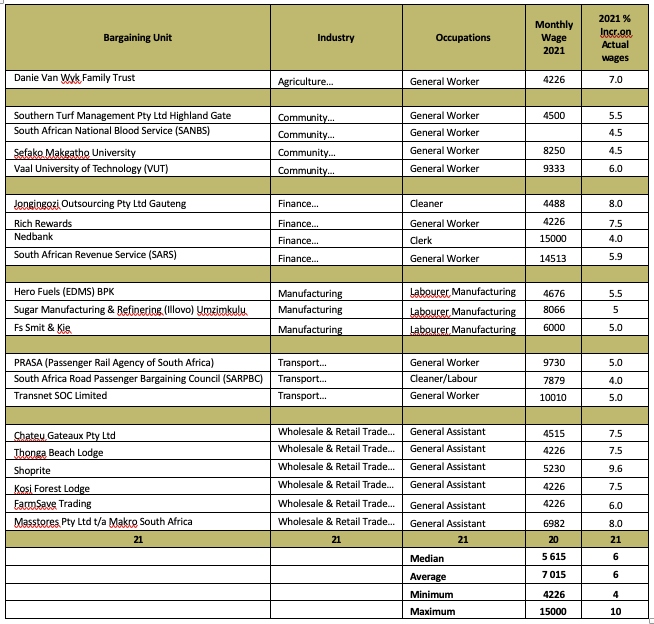
Source: LRS AWARD Database (2021)
References
- LRS Actual Wage Rates Database (AWARD) 2021: http://lrs.org.za/award
- Consumer Price Index, Gross Domestic Products and Quarterly Labour Force Survey publications: http://www.statssa.gov.z
- Pietermaritzburg Economic Justice and Dignity, household affordability Index December 2021: https://pmbejd.org.za