Price inflation: Cost of living
The first thing to be aware of is that inflation is backwards-looking. For example, if the latest inflation number is for September 2021 and it is reported to be 5%, then this tells us what happened to prices over the last 12 months (from September 2020 to September 2021). If a worker receives a 10% increase and the price of the goods that the worker buys also increase by 10%, then that worker will not be able to buy anything beyond what they bought previously, even though they appear to have more money. The worker, therefore, has exactly the same buying power they had before despite the 10% increase.
The inflation rate as measured by the Consumer Price Index (CPI) was 5% in September 2021. This means that the price of goods and services generally increased by 5% from September 2020 to September 2021.
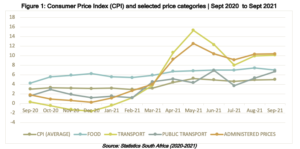
Overall CPI is made up of different categories of goods and services. So, for example, while overall CPI increased to 5%, the price of transport and transport-related items increased by 10.1% and the price of public transport increased by 6.7%. Administrative prices (school fees, telephone, electricity, trains, and petrol/paraffin) increased by 10.4% and the price of food increased by 7% in September 2021.
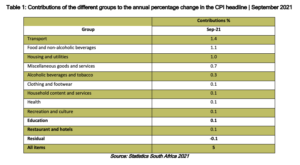
The table below shows the contribution of the main kinds of expenditure on the inflation rate. The prices of food, non-alcohol beverages and miscellaneous goods and services were the biggest contributors to the annualised inflation rate of 5% in September 2021.
We can also see which sub-categories are currently driving inflation. CPI was 5% in September 2021, but other annualised items recorded increases above the consumer price index. For example, fish (27.5%), private transport operation (22.4%), oil and fats (21.6%), meat (8.6%), vegetables (6.7%) and fish (7%).
Inflation by expenditure group
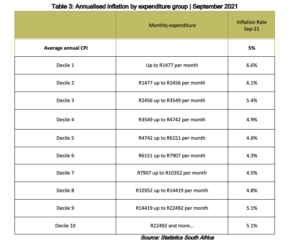
There is more than one inflation number. Different groups, from the very poor to the wealthy, can experience different rates of inflation because they buy different things. The very low group (Decile 1) experienced an inflation rate of 6.6%, higher than the headline inflation rate of 5%, while the very high expenditure group (Decile 10) saw an inflation rate of 5.1% in September 2021.
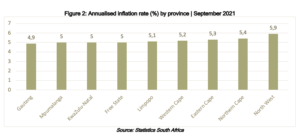
Inflation rate by province
The provinces with an annual inflation rate lower than or equal to headline inflation were Gauteng (4.9%), Mpumalanga (5%), KwaZulu-Natal (5%) and Free State (5%). The provinces with an annual inflation rate higher than headline inflation were Limpopo (5.1%), Western Cape (5.2%), Eastern Cape (5.3%), Northern Cape (5.4%), and North-West (5.9%).
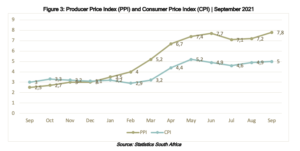
Producer Price Index
The Producer Price Index (PPI) measures an average change in the price of a basket of representative goods and services sold by manufacturers and producers in the wholesale market. The PPI can assist us in understanding what inflation might do in future. While many factors can influence the inflation rate, the trend in PPI is one way of predicting what prices will do in the short term.
Figure 3 below shows that the annualised PPI increased to 7,8% in September 2021 from 2,5% in September 2020. The CPI, which measures price changes in a basket of goods and services bought by the average household, increased to 5% in September 2021 from 3% in September 2020.
The unemployment rate in Q3 of 2021
The unemployment rate increased to 34.4% in Q2 2021, from 32.6% in Q1 2021. This translated to a percentage change of 1.8% quarter-to-quarter.
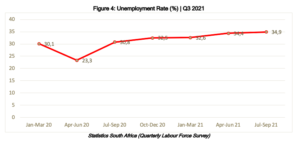
The number of employed persons decreased in all industries except in finance where employment increased by 138 000. The largest decrease in employment was recorded in Trade (-309 000), followed by Community and social services (-210 000), Construction and Private households (-65 000 each).

Economic Growth and GDP
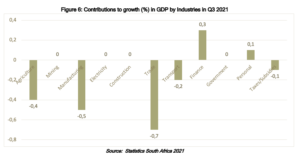
Real gross domestic product (measured by production) declined by -1.5% in the third quarter of 2021, while the second quarter of 2021 recorded an increase of 1.1%.
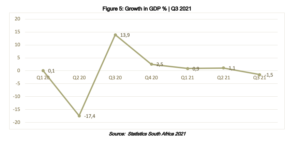
The graph shows that six industries recorded negative growth in the third quarter of 2021. The largest negative contributors to growth in GDP in the third quarter were: trade (-0,7), manufacturing (-0,5%), and agriculture (-0,4%) industries.
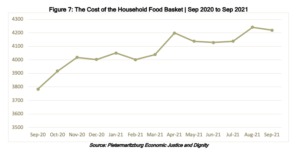
Month-on-month household food basket index Q3 2021
The household food index is specifically designed to measure food price inflation as experienced by households living on low incomes in Pietermaritzburg but may be used to give insight on food price inflation as experienced by households living on low incomes in South Africa.
The graph below shows that the cost of the household food basket increased from R3 783 in the third quarter of 2020 to R4 219 in the third quarter of 2021. This translates to an increase of R436 or (11,5%) between quarter three of 2020 and 2021.
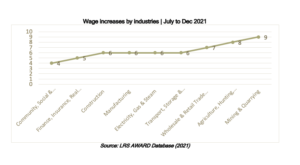
Wage indicators
The LRS Actual Wage Rates Database (AWARD) samples agreements in any given year to determine the median wage increase across various industries. The information can be used to inform negotiations.
The table below provides wages and percentage wage increases in various industries, from July 2021 to December 2021. Workers in the mining sector received the highest median wage increase of 9%, while the community, social and services sectors workers recorded the lowest median wage increase at 4%.
References
- Labour Research Service (Actual Wage Rates Database)
- Statistics South Africa (CPI, PPI, GDP QLFS publications)
- Pietermaritzburg Economic Justice and Dignity (Household Affordability Index 2021)
___________________
Check out: LRS Wage Calculator – Know how much a percentage increase is an amount of money. Understand the effect of inflation on the wage increase.
You might also like:
Bargaining Benchmarks | September 2021
Using labour laws in union bargaining: 12 possible workplace scenarios