

Bargaining Benchmarks is a resource for trade union negotiators. It provides negotiators with a series of benchmarks that will help them enter into bargaining processes as informed role players.
Price inflation – Cost of living
Inflation is the rate at which prices increase over time, resulting in a fall in the purchasing power of money. It is measured as an annual percentage increase (for example, March 2020 to March 2021). Inflation is almost always presented as an annualized number covering the previous 12 months.
The easiest way to understand inflation is to think of buying power. If a worker receives a 10% increase but the price of the goods that the worker buys also increase by 10%, then that worker will not be able to buy anything beyond what they bought previously, even though they appear to have more money. The worker, therefore, has the same buying power they had before, despite the 10% increase.
Consumer Price Index (CPI) measures changes in the price level of the market basket of consumer goods and services purchased by households. CPI represents the overall increase in the prices of all goods. The inflation rate as measured by the CPI was 3.2% in March 2021. This means that the price of goods and services generally increased by 3.2% from March 2020 to March 2021. You can find this monthly release at www.statssa.gov.za/
Figure 1: Consumer Price Index (CPI) and selected price categories Q1 2021
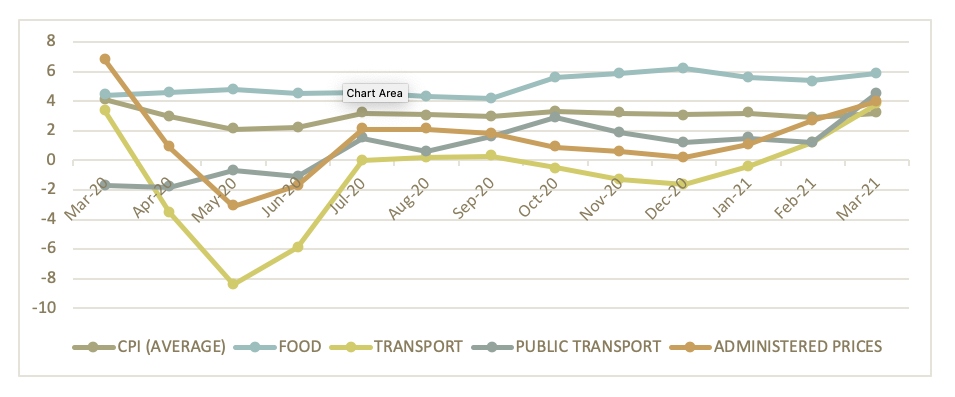
Source: Statistics South Africa
While overall CPI increased to 3.2%, the price of transport of transport-related items increased by 3.8% and the price of public transport increased by 4.5%. Administrative prices (school fees, telephone, electricity, trains, and petrol/paraffin) increased by 4% and the price of food increased by 5.9% in March 2021.
Table 1 shows the contribution of the main kinds of expenditure on the inflation rate for March 2021. You can see that food and non-alcohol beverages and miscellaneous goods and services prices were the biggest contributors to the annualized inflation rate of 3.2% in March 2021.
Table 1: Contributions of the different groups to the annual percentage change in the CPI headline in March 2021
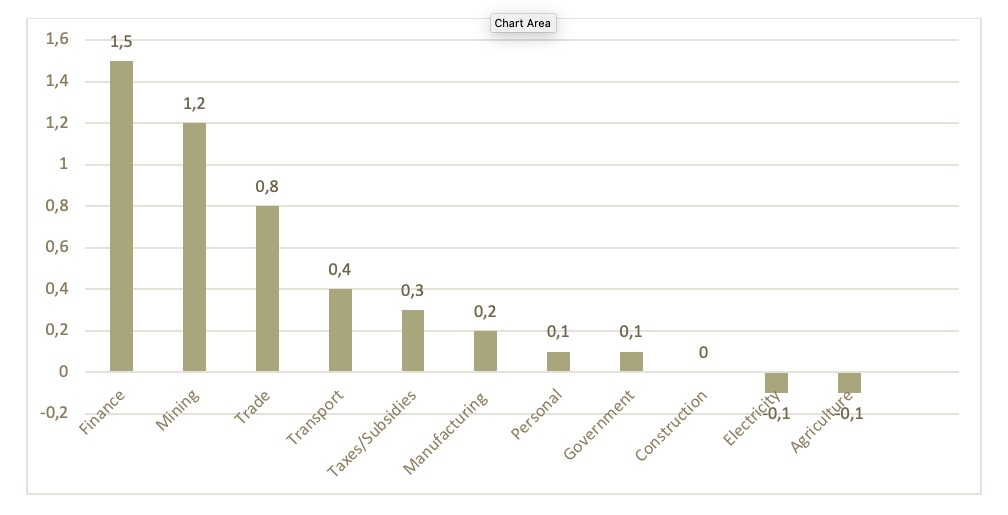
Source: Statistics South Africa
Remember that the inflation rate describes a rate of increase. So, if annualised inflation is lower this month than it was last month, it does not mean that things are cheaper. It just means that the prices increased more slowly than they did before. If we look even closer, we can see which sub-categories are currently driving inflation.
Although the CPI came at 3.2% in March 2021, other annualized items recorded increases above the consumer price index. For example, milk, eggs and cheese (6.4%), bread and cereals (5%), meat (7.3%), fish (5.3%), fruits (11.8%) and water and electricity 6%.
Inflation by expenditure group
There is more than one inflation number. The inflation rate that is reported in mainstream media is the average inflation rate. Different groups, from the very poor to the wealthy, can experience different rates of inflation because they buy different things. The very low group (Decile 1) experienced an inflation rate of 3.9%, higher than the headline inflation rate of 3.2%, while the very high expenditure group (Decile 10) had an inflation rate of 3.3% in March 2021.
Table 3: Annualised inflation by expenditure group | March 2021
Source: Statistics South Africa
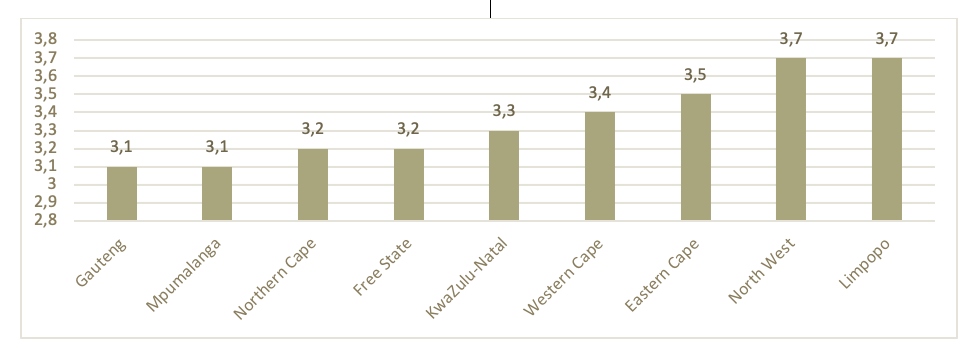
Inflation rate by province
The province with an annual inflation rate lower than or equal to headline inflation was Gauteng (3.1%), Mpumalanga (3.1%), Northern Cape (3.2%) and Free State (3.2%). The provinces with an annual inflation rate higher than headline inflation were KwaZulu-Natal (3.3%), Western Cape (3.4%), Eastern Cape (3.5%), North West (3.7%) and Limpopo (3.7%).
Figure 2: Annualised inflation rate (%) by province | March 2021
Source: Statistics South Africa
Producer Price Index
The Producer Price Index (PPI) measures an average change in the price of a basket of representative goods and services sold by manufactures and producers in the wholesale market, while CPI measures price changes in a basket of goods and services bought by the average household. The PPI can assist us in understanding what inflation might do in future. Many factors can influence the inflation rate, but the trend in PPI is one way of predicting what prices will do in the short term.
The chart below shows that the annualized PPI declined to 3.3% in March 2021 from 4% in February 2021. The Consumer Price Index (CPI) declined to 3.2% in March 2021 from 2.9% in February 2021.
Figure 2: Producer Price Index and Consumer Price Index | March 2021
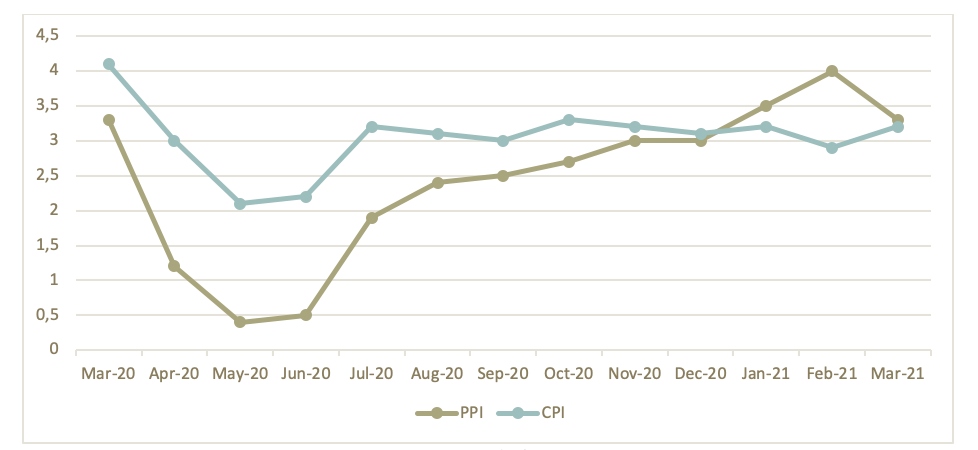
Source: Statistics South Africa
Unemployment rate Q1 2021
The unemployment rate is the proportion of the labour force that is unemployed.
Figure 4 shows that the unemployment rate in South Africa increased to 32.6% in Q1 2021, from 30.1% in Q1 2020. This translated to a percentage change of 2.5% year-on-year. On a quarterly basis, the unemployment rate increased from 32.6% in Q1 2021 from 32.5% in Q4 2020. This translated to an increase of 0.1%.
Figure 4: Unemployment rate (%) | Q1 2021
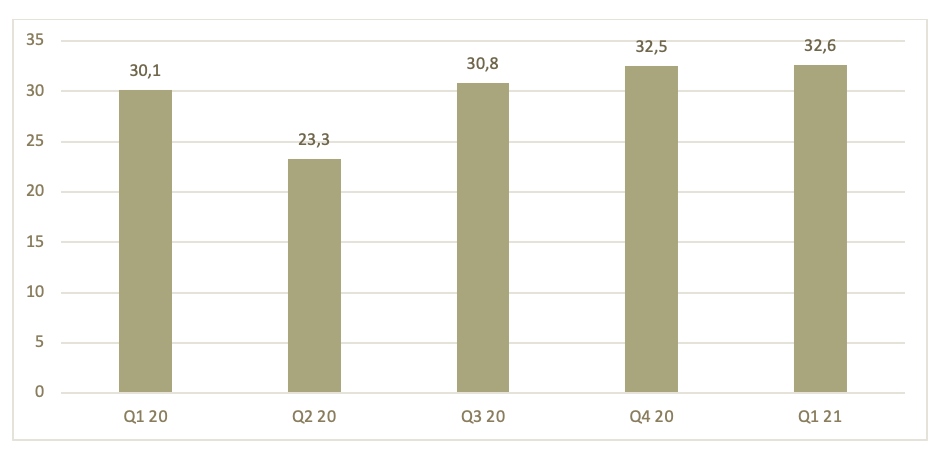
Source: Quarterly Labour Force Survey, Statistics South Africa
Economic growth and GDP
The GDP represents the total market value, or prices, of all final goods and services produced in an economy during a period. GDP is expressed as a comparison to the previous year or quarter.
Real gross domestic product (measured by production) increased at an annualised rate of 4.6% in the first quarter of 2021, following an increase of 5.8% in the fourth quarter of 2020.
Figure 5: Growth in GDP % Q1 2021
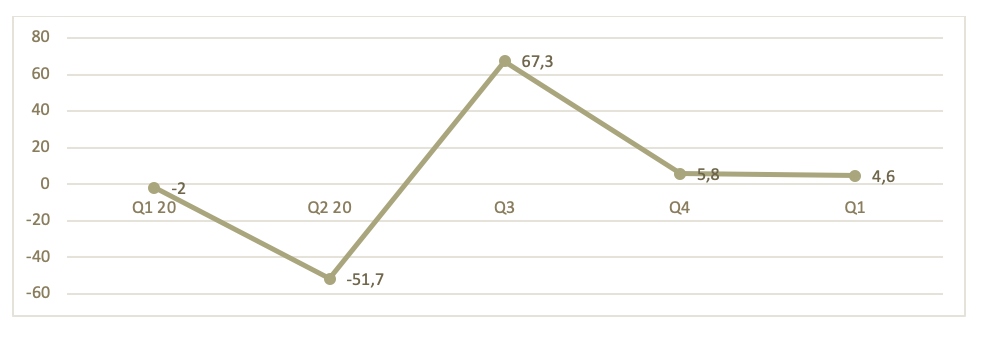
Source: Statistics South Africa
Eight industries recorded positive growth between the fourth quarter of 2020 and the first quarter of 2021.
The largest positive contributors to growth in GDP in the first quarter were the finance (1.5%), mining (1.2%) and trade industries (0.8%). Negative contributors to growth in GDP in the first quarter were electricity (-0.1%) and agriculture (-0.1%).
Figure 6: Contributions to growth (%) in GDP by industries | Q1 2021
Statistics South Africa
Month-on-month household food basket index Q1 2021
The household food index is designed to measure food price inflation as experienced by households living on low incomes in Pietermaritzburg. It can be used to give insight on food price inflation as experienced by households living on low incomes in South Africa. The graph below shows that the cost of the household food basket increased to R4 040 in March 2021 from R3 104 in March 2020. This translate to an increase of R936 or (30.1%) between March 2021 and March 2020.
The Cost of the Household Food Basket | March 2020 to March 2021
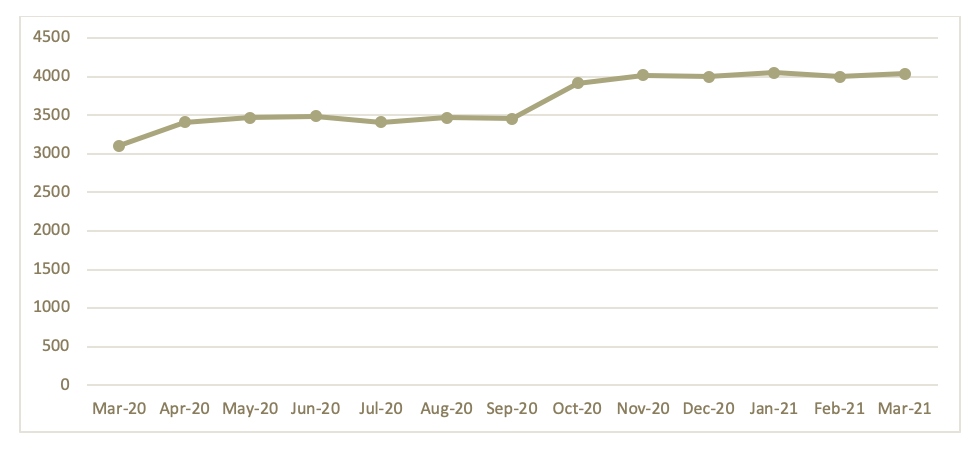
Source: Pietermaritzburg Economic Justice and Dignity
Wage indicators
The Actual Wage Rates Database (AWARD) of the Labour Research Service samples agreements in any given year to determine the median wage increase across various industries. The information can be used to inform bargaining cases.
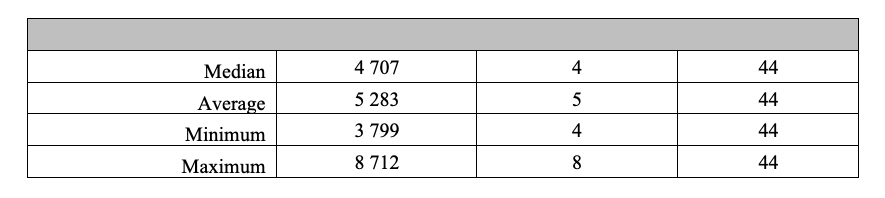
Table 5 below provides wages, percentage wage increases and hours of work by various industries in the first quarter (Q1) of 2021. It shows the median, average minimum and maximum wages, percentage and hours of work in the first quarter of 2021.
Table 5: All sectors decentralised level wages, percentage increases, and hours of work | Q1 2021
Source: LRS AWARD Database
The table below shows the median, average minimum and maximum wages, percentage and hours of work in the first quarter of 2021. The wage settlement provides for a wage increase of 3.7 per cent with effect from March 1, 2021, and a further 4.2 per cent increase with effect from 1 September 2021.
Table 6: All sectors bargaining council wages, percentage increases, and hours of work | Q1 2021
Source: LRS AWARD Database
As seen in the table below, some sectors scored big wage increases due to the adjustment of the national minimum wage in 2021.
The minimum wage for farmworkers was adjusted to the national minimum wage, after earning 10% less in 2020. The minimum wage for farmworkers increased from R18.68 in 2020 to R21.69 in 2021. This translated to an increase of R3.01 per hour (R3650 to R4226 per month) or 16.1%. The domestic workers minimum wage increased from R15.57 in 2020 per hour to R19.09 per hour in 2021. This translated to an increase of R3.52 per hour ((R3034 to R3720) or 22.6%.
The table below shows that the lowest minimum wages was found in the domestic worker sector at R3 034 in 2020 and R3 720 in 2021 and the highest minimum wage was recorded by contract cleaning sector area A at R4 450 in 2020 and R4 651 in 2021.
Table 7: Sectoral determination minimum wages | 2020-2021
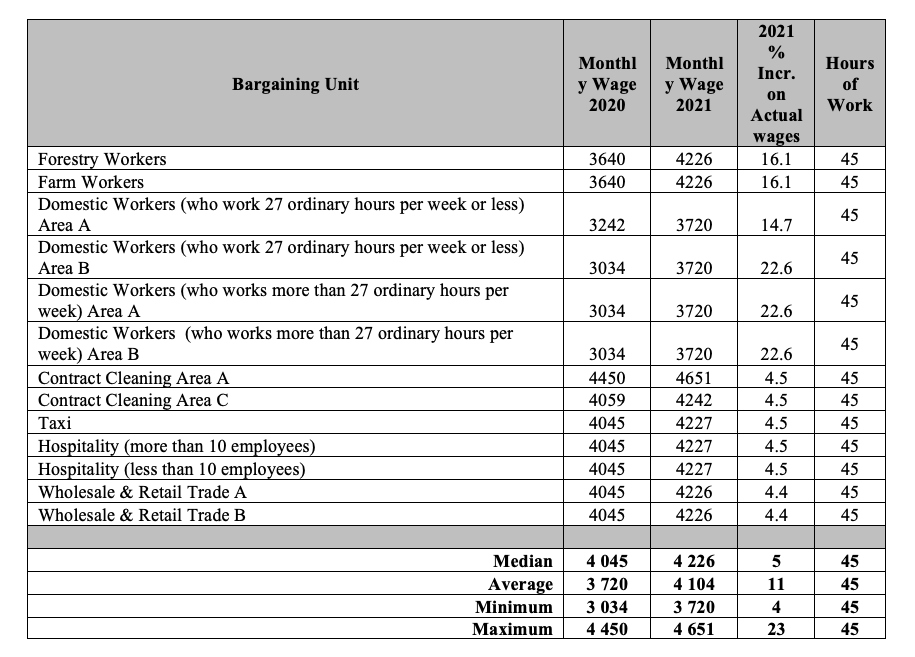
Source: LRS AWARD Database
References
- Bargaining Council for the Motor Ferry Industry (BCMFI) collective agreements. 2021. Available at http://www.mibco.org.za
- Labour Research Service, Actual Wage Rates Database (AWARD). 2021. Available at http://lrs.org.za/award
- National Bargaining Council for the Road Freight Logistics Industry (NBCRFLI), collective agreements. 2021. Available at http://www.nbcrfli.org.za
- Statistics South Africa, 2021. (CPI, GDP, QLFS publications). Available at http://www.statssa.gov.za
- National Bargaining Council Electrical Industry (NBCEI) collective agreement 2021 available at http://www.nbcei.co.za
- Pietermaritzburg Economic Justice and Dignity, household affordability Index December 2021. Available at https://pmbejd.org.za
- National Bargaining Council for the Clothing Manufacturing Industry (NBCCMI) collective agreement 2021. Available at https://nbc.org.za/